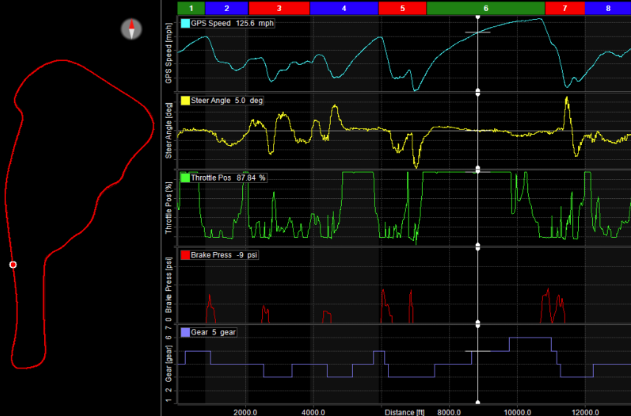
Driver Data: How Looking at it Differently can be Helpful Most of the time when I see people analyzing their data, they are looking at Time Distance Graph with all the normal squiggly lines – RPM, Speed, Steering, Throttle, Brake, and Gear. Exhibit 1 shows what I’m referring to here. Exhibit 1This type of data […]
An Example of a Driver Using Corner Radius Data A few weeks ago I was coaching one of my clients in his Spec Miata at the NASA National Championships at UMC and an opportunity presented itself to study corner radius data. This is due to the fact that my customer (Driver A) had some data […]
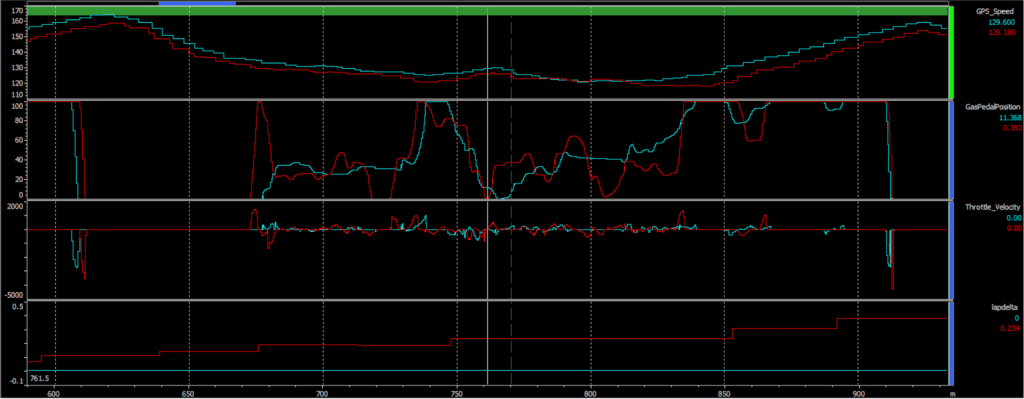
Throttle Application/Throttle Velocity In the throttle application graph seen above, there are four traces: Speed, Throttle (GasPedalPosition), Throttle Velocity, and Delta Time (lapdelta). The blue is generated by a professional race driver; the red by an amateur. The car and track are the same (a left-hand corner quickly followed by a right-hand corner). The hump […]