A Real World Example of Using Corner Radius Data
An Example of a Driver Using Corner Radius Data
A few weeks ago I was coaching one of my clients in his Spec Miata at the NASA National Championships at UMC and an opportunity presented itself to study corner radius data. This is due to the fact that my customer (Driver A) had some data from another driver (Driver B) who had a faster lap time and we were curious as to how this other driver was able to go faster. We discovered that the biggest delta in time was in the UMC Outer Turn 3 and Turn 4 complex. We only had GPS data from this other driver which meant that we had Speed, G Forces, and Positioning (in order to study the driven line). Just looking at each of these individually can provide lots of information. These are shown in Exhibit 1. The driver that I was working with is the blue trace and the faster driver is the orange trace. Note that Turn 4 is a double apex corner so the driver opens his hands between the two apexes as can be seen in the lateral G trace.
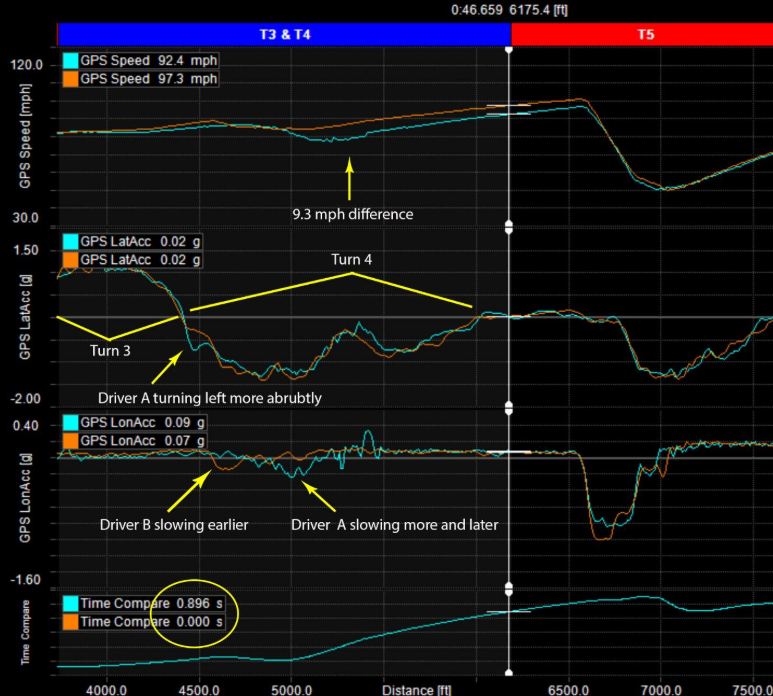
Exhibit 1

Exhibit 2
The 9.3 mph difference exiting Turn 4 is obviously huge and the time delta at the end of the T3 & T4 split was almost 0.9 seconds. I noted a few other items in Exhibit 1. Driver A had a more abrupt turn in for Turn 4 and carried more speed into the corner but was slowing while Driver B was accelerating. On the other hand, Driver B had a more gradual turn in for Turn 4 and he slowed earlier than Driver A. Exhibit 2 shows the lines driven through Turns 3 and 4 by both drivers and it shows that Driver B took a slightly tighter line in Turn 3 whereas Driver A took a tighter line in Turn 4. Btw, GPS Position Accuracy was about 2.5 ft so good enough for this type of analysis. All good information but the corner radius data can give us even more information.
First, here is the Corner Radius math channel for AIM RS3 Analysis: (((“GPS Speed”*1.46667)^2)/(“GPS LatAcc”*32.17405)). As you can see, it is using both speed and lateral G’s. GPS Speed is being converted from mph to ft/second and then squared and therefore the units are ft2/sec2. GPS LatAcc is being converted from G’s to ft/sec2. After the division, the result is the radius of the corner in feet. If you ever seen a track map with the corner radiuses specified, compare those numbers to numbers you calculate with this formula — I have found them to be amazingly accurate. One thing to keep in mind is that the Corner Radius calculation approaches infinity when the car is going in a straight line. Therefore, you either need to use a Band Pass filter or change the scale so that you can see the traces changing. In Exhibit 4 I changed the scale to -2000 ft to 2000 ft. Most corners on race tracks are tighter than 500 ft so 2000 ft is plenty large enough. However, since the scale is limited, vertical lines will be generated when the car is changing direction.
The great thing about the Corner Radius calculation is that it doesn’t depend on steering input. It is simply going to show the radius of the trajectory that the car is on at a single point in time. If the back end of the car steps out, then the corner radius changes. You can also see exactly when the driver starts the turn and when he finished the turn. Plus, the shapes of the traces can tell you if the driver took a normal apex, an early apex, or a late apex. Exhibit 3 shows what the shapes of the traces would look like for each of these types of apexes.

Exhibit 3
Getting back to how I used the Corner Radius traces with my customer, Exhibit 4 shows some of the most notable differences between the two drivers. The most important one being the initial turn by Driver A into Turn 4 because this affected the rest of the corner. This is due to the fact that Driver B turned in quite a bit later and his slowing the car down more initially allowed him to turn in later and open his hands sooner. So the question became, can Driver A match the Corner Radius traces of Driver B and go faster through that section?

Exhibit 4
The answer is YES! As can be seen in Exhibit 5, once Driver A started adjusting how he was driving the Turn 3 and Turn 4 complex his speed and lateral g traces aligned much more closely and the corner radius traces also aligned more closely. Driver A did still turn into Turn 4 a little more abruptly but the opening of his hands in preparation for the Turn 4 exit was much closer to what Driver B did. After these driving adjustments, the delta at the end of the T3 & T4 split dropped to about 0.4 seconds – a 0.5 second improvement!

Exhibit 5
Driver A still has a little more to work on to match the corner radius traces of Driver B but at least now he knows what he needs to do to go faster through the T3 & T4 complex.
Good luck in your races!