How to Properly Use Throttle Application and Throttle Velocity
The Importance of Throttle Application & Throttle Velocity
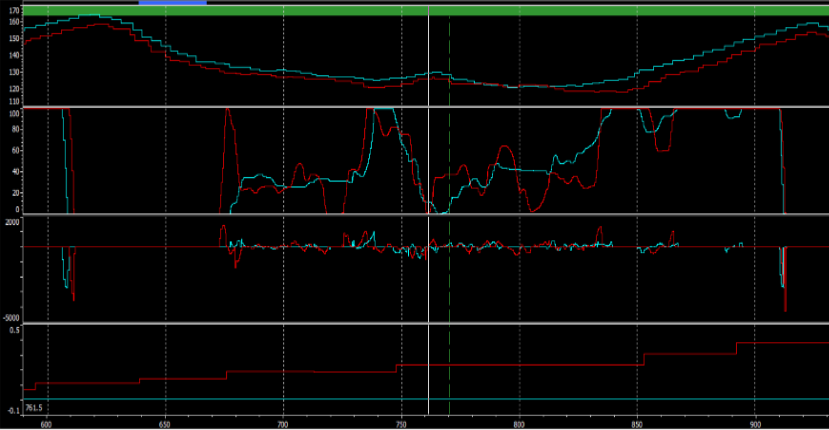
In the graph, there are four traces: Speed, Throttle (Gas Pedal Position), Throttle Velocity, and Delta Time (lap delta).
The blue is generated by a professional race driver; the red by an amateur. The car and track are the same (a left-hand corner quickly followed by a right-hand corner). The hump in the middle of the speed trace indicates when the car changes direction from left to right.
As you can see, the pro driver is making a conscious effort to smooth out his throttle application because there is a decent amount of understeer here. He doesn’t want to lift off of the throttle completely, so he pauses his throttle application until the front tires have enough grip to apply more throttle. The amateur is too focused on getting to more throttle quickly and then lifts quickly when the understeer develops.
When a driver applies throttle and then releases it, weight transfers. The pro driver is doing a much better job controlling the speed of the weight transfer and, therefore, the car’s balance.
When looking at the throttle velocity, the flat line is at the 0 mark, and above the line is throttle application, and below the line is lifting off of the throttle. It is easy to see that the amateur driver generates more peaks when applying and lifting off the throttle. However, having a high negative peak when transitioning from throttle to brake isn’t wrong.
It is easy to look at the velocity of a channel in your data if you’re ever curious!
Create a math channel using the derivative function. This data comes from Wintax software, and my math channel is deriv (Gas Pedal Position).
Looking at Steering Velocity, Throttle Velocity, and Brake Velocity is a great way to assess the smoothness of the driver and can identify something for the driver to work on!