Analyzing Braking Techniques to Improve Speed
Braking Techniques to Help You Improve Your Speed
Who Needs Brakes?
Well, the answer to that question is, everyone! Last month I wrote about different ways to analyze throttle information. This month I’m going to go over some different ways to analyze braking information, or more importantly, slowing information. Obviously applying the brakes slows the car down but sometimes simply lifting off of the throttle is all the driver needs to get the car to do what they want it to do. Nobody wants to slow the car down unnecessarily but how the driver slows the car down can be a huge reason that a driver is turning good lap times.
When it comes to analyzing braking techniques, one of the first things that I look at is the brake trace – especially for a slow corner after a long straight. Most cars have some understeer and it frequently shows up the most in the slow corners since that is when the most steering input is being used. If the car has some understeer in a slow corner, then trail braking is usually required. And to properly trail brake, the driver needs a slow release of the brake pressure. Getting to the most brake pressure as quickly as possible when the car is going the fastest is also important. Therefore, the driver should hit the brakes hard and then start releasing the brakes with the goal of being off of the brake pedal at the apex. Exhibit 1 shows a good example of trail braking at turn 1 at the Circuit of the Americas.
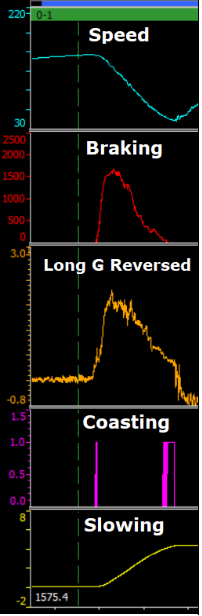
Exhibit 1
There are several traces in Exhibit 1 – Speed, Brake Pressure, Longitudinal G’s Reversed, Coasting, and Slowing. I reverse the Longitudinal G’s in order to get the trace to match to the Brake Pressure trace. You can tell a lot just by looking at the Speed trace. For example, you can see that the slope of the Speed trace changes before the minimum speed which indicates that the car is slowing down less than when the driver first applied the brakes. But by having the other traces, a little more can be gleaned from the data.
The Longitudinal G Reversed trace can easily by substituted for Brake Pressure if the car doesn’t have a brake pressure sensor. But what you can’t tell from that trace is that the driver coasted a small amount before applying throttle. The reason the driver did this is because they wanted to keep the load on the front tires a little longer in order to counter any understeer they were feeling. At the bottom of Exhibit 1 is the Slowing trace which is a math channel that is taking the integral of the Longitudinal G’s Reversed channel if that value is greater than 0. The slope of the Slowing trace is much steeper when the driver is on the brakes, but the slope changes when the driver is coasting. Nevertheless, this shows that the car is still slowing down. Therefore, that little bit of coasting is still part of the trail braking phase.
I also find it helpful to see some of these traces in track reports as well. Exhibit 2 shows what Braking, Coasting, and the Longitudinal G’s Reversed would look like on track reports. Looking at the Long G Reversed on the track report really shows that the driver was at the apex and had the car pointed where they wanted before applying throttle.

Exhibit 2
XY or Scatter Plots can also be very helpful when analyzing braking. Exhibit 3 shows Steered Angle on the X axis and Brake Pressure on the Y axis. This shows that once the driver has released the brake pressure to about 600 psi, they start adding steering as they are releasing the brake pedal. The driver obviously isn’t aware of what the brake pressure is when they start adding steering but they do know the point on the track that they want to add steering while trying to time their brake release so that they are off the brakes as close to the apex as possible.
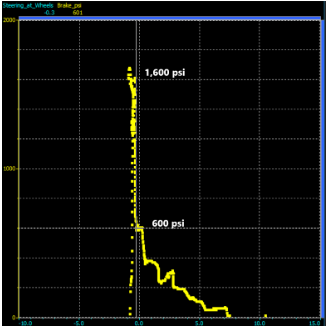
Exhibit 3.
Lastly, one of the other traces that I use a lot is the Brake Velocity trace. This is shown in Exhibit 4 with the Brake Pressure trace.
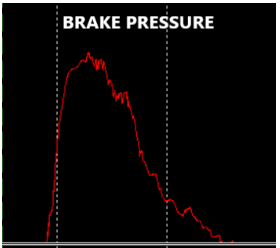
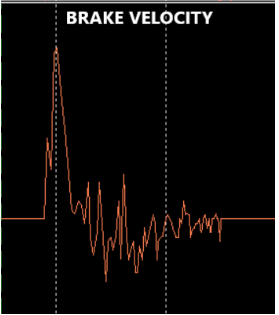
Brake Velocity is a derivative of Brake Pressure. The spikes above the flat zero line show the speed of
brake application and the spikes below the zero line show the speed of brake release. The speed of brake application should always be greater than the speed of brake release in this situation. Also, notice that the speed of the brake release reduces as the driver gets closer to the point that the driver releases the brake pedal.
I focused on braking for a slow corner here, but brake release can be just important for medium speed or even high speed corners. There aren’t many situations where jumping off of the brakes is the best approach since that transfers the load off of the front tires very quickly. Have you ever noticed that when the Formula 1 broadcast shows the onboard footage with throttle and brake that the brake is either on or off? That’s because they don’t want to show the brake release! Brake release is one of the most important tools in a pro driver’s handbook. See if you can master it and go faster as a result!