Using Math Channel Integral Functions
Using Math Channel Integral Functions
One of my favorite math challenge functions is the Integral function. When you take the Integral of a channel in your data you are adding up all of the samples of data that have been gathered for that channel. Typically, there are two Integral functions, the Integral function will provide a total of all of the channels over an entire session. This can be valuable, but I find the Lap Integral function even more useful because this totals all of the data samples over a given lap and then resets when the next lap starts. If you think about it, a lap time is simply a lap integral of the number of seconds that it took to complete the lap. In this article I will go over some of the ways that I use the Lap Integral function.
If I’m trying to figure out if the track grip has changed, then I will always look at the Lap Integral of lateral g’s. Exhibit 1 shows Lateral G’s, the absolute value of Lateral G’s, and Cumulative Lateral G’s for two different laps at Sebring International Raceway. The track was dry for the red lap and the track was damp but drying for the green lap.
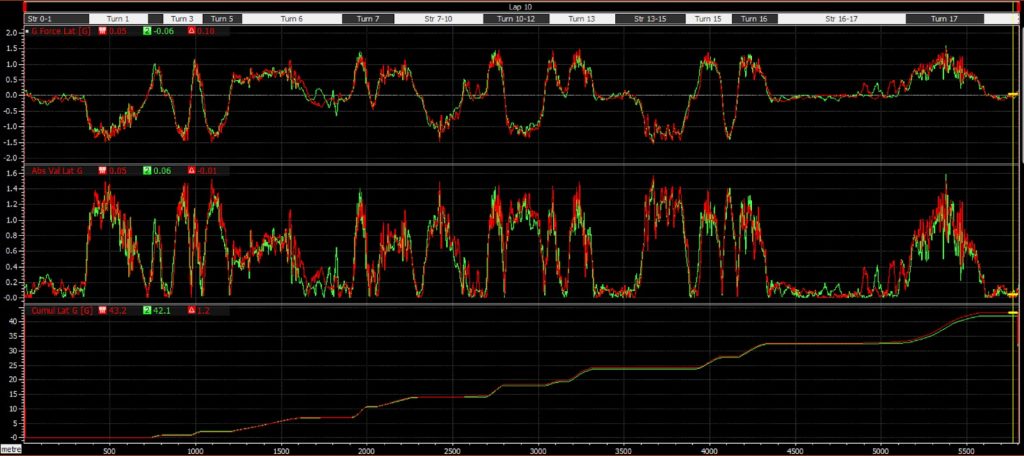
It is more difficult to see the grip level differences by just looking at the Lateral G traces but by looking at the Cumulative Lateral G traces, it is clear to see that over the course of the lap the car was experiencing higher grip levels on the red trace lap vs the green trace lap. Interestingly, it looks like the car was experiencing higher grip levels from Turn 1 through Turn 5 on the green trace lap but a significant amount of grip was lost at the end of the lap as the car was going through Turn 17. The turn numbers can be seen at the top of the graph.
Using the Lap Integral function for calculating distances that something happens over a given lap is another great way to use the function. Exhibit 2 shows a Channels Report where I have calculated the distances for Braking, Throttle, Wide Open Throttle (WOT), and Coasting.

This chart if from the AIM RS3 Analysis software and the colors show the min and max values of each value in each column with blue being the minimum and red being the maximum. In this case, the driver turned his fastest lap when the Distance of WOT was the greatest. The amount of coasting wasn’t the minimum amount but it was a close second. Looking at a chart like this can certainly give some perspective as to how the fastest lap was achieved.
I have also found the Lap Integral function to be useful when looking at some engine health information. Engine Knock for each cylinder is available on the Ferrari Challenge cars and I have found that I look at the cumulative amount of knock for each cylinder can help diagnose an issue easier than looking at the data traces. Engine knock is a phenomenon that occurs when the air-fuel mixture inside the engine’s cylinders ignites prematurely or in an uncontrolled manner so this is not something that you want happening inside of a race engine. Exhibit 3 shows the cumulative values for engine knock for every lap during a session for one of the 488 Evo Ferrari Challenge cars.

The area highlighted in yellow shows that cylinder 1 was having some excessive knocking and this was enough for the team to decide to change the spark plugs, coils, and injectors. Exhibit 4 shows the cumulative engine knock values after these parts were replaced. Looks like replacing the parts solved the issue!

These are just a few examples of how I use the lap integral function. Other values that I look at include the cumulative amount of understeer the car has over a given lap, the cumulative amount of brake pressure the driver is using, and the cumulative amount of acceleration for a given lap or maybe even for a given section of a lap are other values that I might look at. The possibilities are almost endless!
Good luck in your races!!