How to Drive Faster on the Racetrack
I want to Increase My Speed: Why Am I Driving Slower?
In terms of how to drive faster, grip is important. As we all know, the grip level of tracks changes all the time. Sometimes it gets better after more and more rubber is laid down over the race weekend. But the grip level of the track frequently goes away when the ambient temperature rises, and the track becomes more “greasy”. I was working with a client at Sebring International Raceway and this was his assessment after driving on the track in the afternoon versus in the morning. And his times were better in the morning when the temperature was cooler. I was hired to coach him and to help him improve his lap times but what I’m really doing is helping him improve the technical aspects of his driving. In this case, the driver felt like he was driving better but the lap times just weren’t there. I needed to substantiate his claims that he was dealing with less grip, but he was driving better. So, how did I do that?
Well, it isn’t easy to determine change in grip level but here are a few things that I look at as a driving coach. Lateral G’s is certainly something that should be studied but the problem with accelerometer data is that it can be quite noisy and when Lateral G traces are overlaid, it is difficult to tell which trace is truly showing more grip over a lap – unless there is a huge difference in grip in which case the data probably does not even need to be reviewed. Here are the Lateral G traces from one driver’s fastest lap (red) and a slower lap (white) that was turned later in the day when the driver said the track had less grip.

It is very difficult to tell which lap has the most Lateral G’s when looking at these traces. In order to get a better view of this, I like to look at Cumulative Lateral G’s. All that needs to be done to get Cumulative Lateral G’s is to create a math channel using the integral function. But since Lateral G’s are both positive and negative, the absolute value of Lateral G’s is what needs to be integrated. Here are the traces of the Cumulative Lateral G’s for these two laps.

At the end of the lap the total Lateral G’s are 32.2 for the fastest lap and 31.5 for the other lap – a .7 Lateral G difference. This does not sound like much, but that difference equates to 2.17% less Lateral G’s. If there is a direct correlation between this and lap time, then the slower lap would be 2.17% slower than the fastest lap. Therefore, if the fastest lap was 2 minutes or 120 seconds then the slower lap would be 122.6 seconds or 2 minutes and 2.6 seconds. An additional 2.6 seconds of lap time is a huge difference!
Another graph that I like to look at is the friction circle (Lateral G’s vs Longitudinal G’s). I’m not just looking at the maximum G forces, I’m also looking at the shape. Here are the friction circles for both laps with the fastest lap in red and the slower lap in blue.
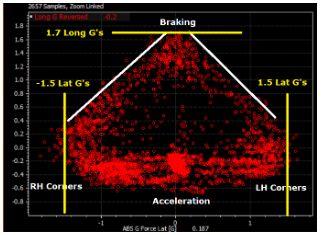
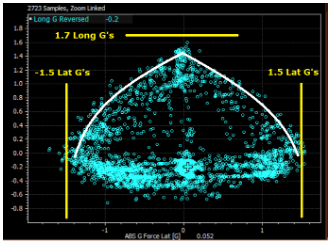
As can be seen when comparing the two charts, there are more G’s under braking as well as cornering on the fastest lap. However, the shape of the friction circle for the fastest lap is more like a Christmas Tree and the shape of the friction circle for the slower lap is more elliptical. This tells me that the driver is transitioning from braking to cornering better because he is maintaining more G’s in the braking to cornering phase of the friction circle. In other words, they are trail braking better and managing the load transfer better. This was exactly what I was asking this driver to do. Even though the lap time didn’t reflect it, the driver was driving better. The best part of this is that this improved skill can be used at his next track event and all future events as well.