
The Difference Between Exploration and Consistency
The topic of consistency has come up several times over the last few weeks with some of my customers. My comments were something like “You should be able to repeat your brake point, brake release point, throttle application point, and full-throttle point lap after lap. If you can do that, your segment times and lap times should also become repeatable.”
I decided to see if I can practice what I preach by doing an experiment on my simulator. I drove a F1600 car at the VIR North Course and ended up doing 17 hot laps which I could use to analyze the data at T1. The F1600 car is a car I have driven some but I’m still learning what it wants to get the best lap time. I chose Turn 1 because it requires a balance between braking, corner entry speed, and throttle application, making it a good corner for studying consistency. Exhibit 1 shows the track and the segment that I’m analyzing is the red T1 segment. The segment starts before braking and ends after I was at full throttle.

Exhibit 1
Exhibit 2 shows the data that I will be analyzing from this session. As you can see, my lap times were pretty consistent with the exception of lap 6 when I spun the car because I tried to brake too deep at one of the other corners. We all make mistakes. Lol
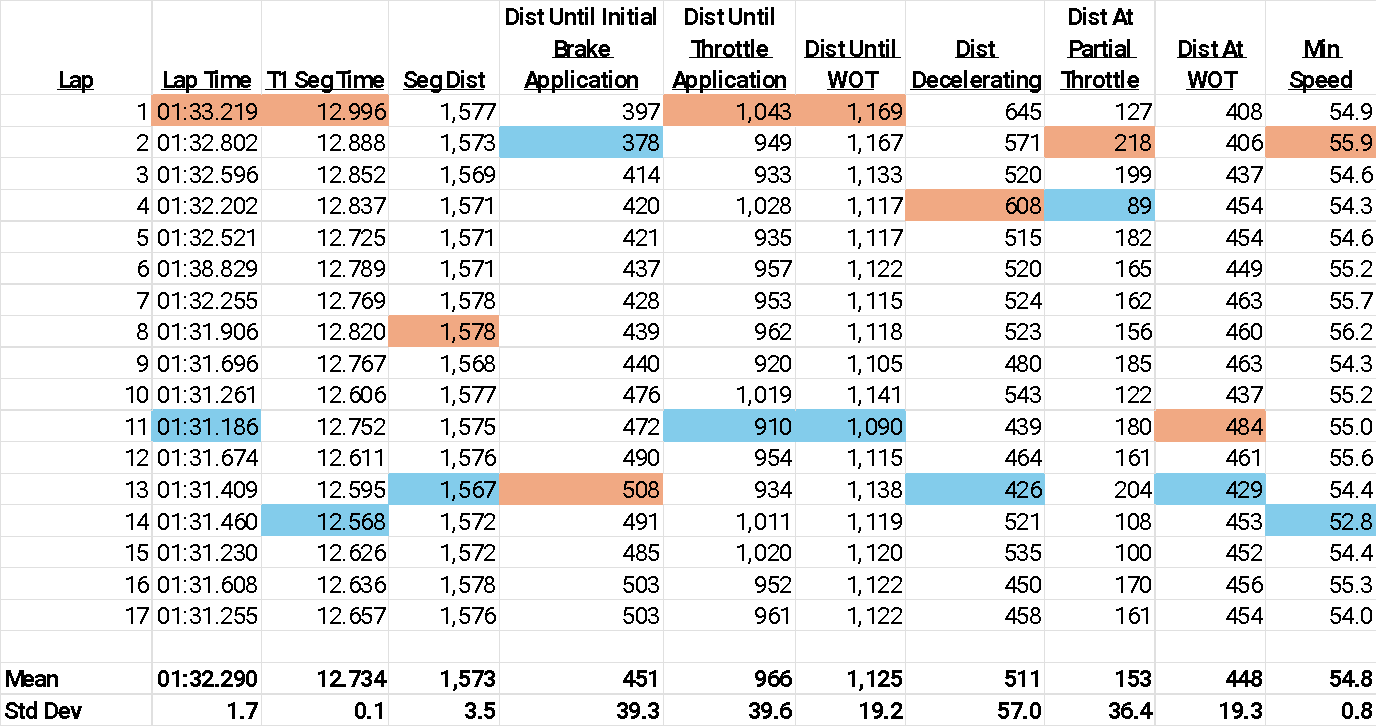
Exhibit 2
I created math channels that calculate the distance from the start of the segment to the point I initially hit the brakes, got to throttle, and got to wide open throttle (WOT). Therefore, the larger the number, the further it is from the start of the segment. From these numbers, I calculated the distance decelerating (which means that it is braking and coasting if there is any), the distance at some throttle but less than WOT, and the distance at WOT. I also included the minimum speed since that is always an important aspect of cornering analysis. The minimum of each column is shaded in blue and the maximum is shaded in orange.
To quantify consistency, I calculated the mean and standard deviation for each measurement. The mean represents the average value, while the standard deviation tells how much the data varied from lap to lap. The larger the standard deviation, the less consistent the result.
The Distance Decelerating had a mean of 511 ft and a standard deviation of 57 ft. In other words, my braking and coasting distance varied by more than 11% from lap to lap. That sounds like poor consistency. However, my T1 segment time had a standard deviation of only 0.1 seconds, or less than 1% of the average segment time. How can those two things both be true?
Well, for one reason, I was initially trying to figure out just how deep I could go on the brakes at T1. The difference between the minimum Distance Until Brake Application of 378 ft which was on lap 2 and the maximum Distance Until Brake Application of 508 ft is 130 ft which is a little more than the distance between the 4 braking marker and the 3 braking marker. At the beginning of the session I was on the brakes a little past the 4 marker and at the end of the session I was on the brakes just after the 3 marker. But the 508 ft point was too far and as a result, I missed the apex on that lap. Therefore, I backed it up my braking point a little bit and you can see that the next four laps after that were much closer together. In fact, it was the next lap (lap 14) when I had the best segment time and that Distance Until Initial Brake Application was only 491 ft. The really interesting part is that the only other column that has a minimum on lap 14 was the minimum speed of 52.8 mph – 2 mph slower than the mean!
So what does all of this mean? Like a lot of things, it isn’t just one thing that leads to consistency. The data showed that I was not executing the corner exactly the same way every lap. My brake point moved, my throttle application point moved, and my minimum speed varied. Yet the segment times remained remarkably consistent. The reason is that I was adapting. If I carried more entry speed, I had to delay throttle application. If I braked later, I might have to adjust my line. If I missed the apex slightly, I had to compensate somewhere else in the corner. Different inputs often produced similar outcomes. Consistency is not necessarily doing the exact same thing every lap. Consistency is understanding why you are changing something and being able to repeat it once you find what works. The real test of consistency is what happened after you found the limit – that’s where consistency becomes valuable.
Early in a session, I don’t necessarily want to be consistent – I want to be exploratory. I may move the brake point later, try a different line, or experiment with throttle application. Once I discover what works best, then the goal becomes consistency.
Improvement comes from exploration. Speed comes from consistency.
As a side note, one of the best ways to tell if you are doing something better on the track is to look at a predictive timer coming out of a corner. It is immediate feedback.
Another side note, if you want to improve consistency and have access to a simulator, use it. A simulator allows you to practice the same corner repeatedly without worrying about tire wear, fuel consumption, or repair bills. 😉
Good luck in your races!